By now we’ve all heard the news that La Niña is the next weather phenomenon poised to toy with California. The National Oceanic and Atmospheric Administration on April 14 issued a “La Niña watch” indicating a 70 percent chance the weather phenomenon would likely take hold by the end of this calendar year.
Which was quickly followed by headlines saying La Niña is likely to worsen the drought in California.
Not so fast.
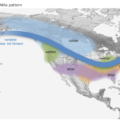
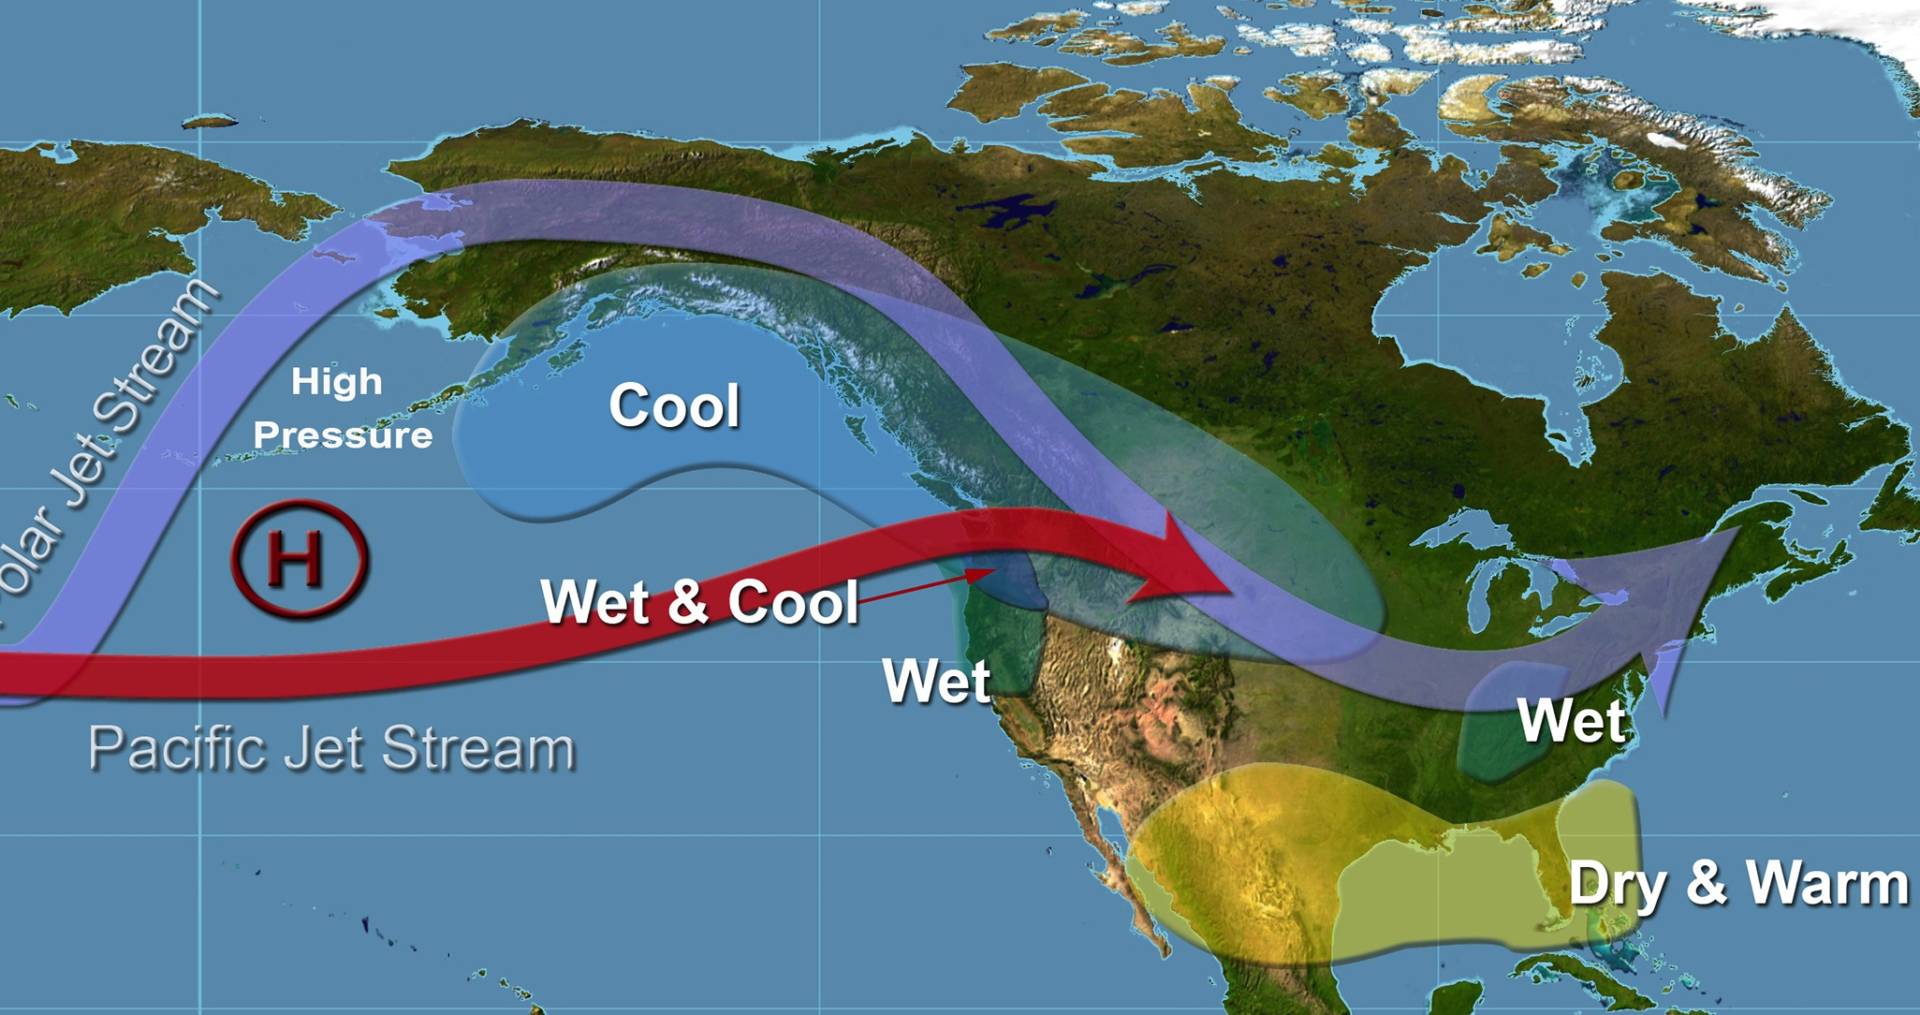
Just as we learned this year there are no guarantees with El Niño, the same is true of its opposite. La Niña is defined by a marked cooling of the equatorial Pacific Ocean, which disrupts global weather patterns just like El Niño does. But instead of making the southwest wetter, it tends to make it drier while detouring storms toward the Pacific Northwest.

Meteorologist Jan Null is photographed at his home in Saratoga on Tuesday, March 31, 2015. Null runs Golden Gate Weather Services from home. (Gary Reyes/Bay Area News Group)
But it doesn’t always go down like that.
To help us make sense of La Niña, Water Deeply asked Jan Null to explain things. Null is a consulting meteorologist and owner of Golden Gate Weather Services in Saratoga. He has also been a consistent voice of reason about El Niño when the media was often crying wolf.
Is La Niña coming?
Jan Null: Probably. More and more, the computer models each of the last two months have been tilting into the negative category (in terms of sea surface temperature anomaly). That’s the sort of thing you start seeing. The average is now −0.8 for all the dynamic and statistical models for November-December-January. If it’s colder than −0.5, then it gets into weak La Niña category. Between −0.5 and 1 is weak; Between −1 and −1.5 is moderate; greater than −1.5 is strong.
Is it typical to have La Niña follow El Niño?
Jan Null: There have now been 24 El Niños going back to 1950. If we look at the total number of La Niñas out of all 24, 17 of those became La Niñas. That’s a pretty high percentage. With the models all pointing toward cooling and with the data, we’re already seeing significant cooling in the Pacific; we’re certainly heading toward a La Niña. So we’ve decided we’re going to have a La Niña. The next thing is, how strong is that La Niña going to be? That’s the big question mark right now.
How important is that to know?
Jan Null: If we look at what the results are in the different categories, it starts giving us an idea of what has happened in the past. The signal is much less definite than with an El Niño. There’s a broader range of solutions under La Niña than under El Niño.
Let’s say we’re going to get into the moderate range. Then it’s important to look at effects on individual climate divisions in the state. Climate Division 2 is arguably the most important, encompassing the Northern Sierra Nevada and Northern Sacramento Valley. If we look at the six moderate La Niña events, three were less than normal rainfall and three were greater than normal. That doesn’t tell me anything. That’s a broad range of solutions for moderate El Niños.
One of these was 1955, an incredibly wet year, with major flooding on the Sacramento and Feather rivers and all Northern California drainages.
The gist of it is, anything can happen. There are no guarantees.
If we go down to Climate Division 6, in coastal Southern California, then you can see that three of those were well below normal, two were slightly below normal and only one of the six was above normal.
Is it reasonable at this stage to say La Niña means another drought year?
Jan Null: No, it’s not. Because, maybe we’ll have a 1955-56. And just look at this past winter. Was this past winter a drought year, or a break in the drought? If you’re in the northern half of the state, you’re probably saying it’s a break in the drought. If you’re in the southern half, you’re probably going to say the drought continues.
The bottom line, is I don’t have any answers. If anybody says they have answers, they’re selling you snake oil. There are no reliable tools for long-range weather forecasting, period. Five, seven, ten days have gotten phenomenally good. Out past that, it’s nothing I would get my wallet out for.
What does the timing look like for this La Niña?
Jan Null: We kinda get into the negative category in midsummer, so somebody at the (National Weather Service) Climate Prediction Center will probably come out and say we’re in a La Niña officially. But it really doesn’t matter until we get to November, for the most part. Because that’s our rainy season, it kinda doesn’t matter what La Niña does between now and then. Our rainfall season is November through March.
How should we be reacting to this La Niña?
Jan Null: First of all, the people on TV should not be jumping up and down crying Chicken Little like they did with El Niño. The impacts of El Niño were not particularly well forecast. Even in print media, in headlines, they all focused on the extreme end of a wet El Niño, and they didn’t put in the range of solutions that were possible. It all became clickbait. So be wary of clickbait. Read the entire article.
Most of the articles have reasonably good data in them. But headlines do not portray that, and so much is driven by the headlines. That becomes people’s takeaway. So it makes it really tough for a good science message to get out there. I would tell people, read the science, don’t just read the headlines.
Is there anything influencing this La Niña that’s unusual?
Jan Null: El Niño and La Niña are not the biggest phenomena. You have this whole other alphabet soup of things going on in the planet. You have the Pacific Decadal Oscillation, the Arctic Oscillation, the North Atlantic Oscillation. When they line up the right way, they can make a La Niña stronger.
But again it’s way too many variables, especially when they’re all interacting with each other. In some ways, it’s like a snake eating its tail. There are all these different feedbacks going on. I haven’t seen anybody who’s deciphered all of them.
Water Deeply: What kind of La Niña should we root for?
Jan Null: The La Niña is not going to be the same for everybody. If we’re going to get water in the state, and we can’t have it everywhere, I want it to be like this past winter. I want it to be where the biggest reservoirs are – in the north.
What sort of La Niña is likely to deliver there?
Jan Null: The ones that have best probability there are the moderate La Niña. With a moderate, it’s 50/50 odds. For Southern California, the odds are much less. But there aren’t that many reservoirs in Southern California.
Of the 10 worst flood years … only four of those were El Niño, four were neutral and two were la Niña. So again, that’s a pretty big spread. But it does say, if we’re looking at La Niña, you can get flooding in a La Niña. And two of the most memorable flood years in the state were December 1955 and December 1964, and those were both La Niña years.
There are no guarantees. The range of solutions is too big.
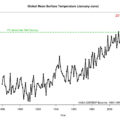
Also, the 800-lb gorilla in the room is our warmer atmosphere over our warmer oceans. So how is this shifting the impact? With a moderate La Niña in 1955, is it the same as a moderate La Niña in 2016? We see that with land temperatures, precipitation patterns. Things don’t stay the same. They are evolving. You don’t keep the same average over time.
Categories: Drought