Scott Sutherland
Meteorologist/Science Writer
Thursday, July 21, 2016, 6:03 PM – Soaring global temperatures. Months of record low Arctic sea ice extent. Unusual weather patterns. 2016 has been racking up some incredible records so far, but there’s signs that 2017 may buck the trend of the past three years.
NOAA and NASA have released their latest analyses of global temperatures, for June and for the first half of 2016 so far, and the world is setting even more records for heat.
• Hottest month of June on record. Compared to the 20th century average, it came in at +0.90oC according to NOAA and +0.80oC according to NASA. (The Japan Meteorological Agency records it at +0.76oC, which ties their record for June 2015)
• 40th consecutive month of June with an average global temperature anomaly that put it above the 20th century average, according to NOAA, with June 1976 being the last month of June with a temperature below the 20th century average.
• 378th consecutive month with an average global temperature above the 20th century average, based on NOAA records. December 1984 was the last month that was below the average.
• Hottest January to June year-to-date on record, at +1.05oC above the 20th century average, according to NOAA.
• Now at the spearhead of a 14-month long streak of record-breaking hottest months, since May 2015, continuing the longest such string of broken records in NOAA’s 137-year tally of global temperatures (May 2016’s 13-month streak was the previous record).
Based on a NASA comparison to pre-20th century temperature records, the first half of 2016 racked up a temperature of more than 1.3oC above average.
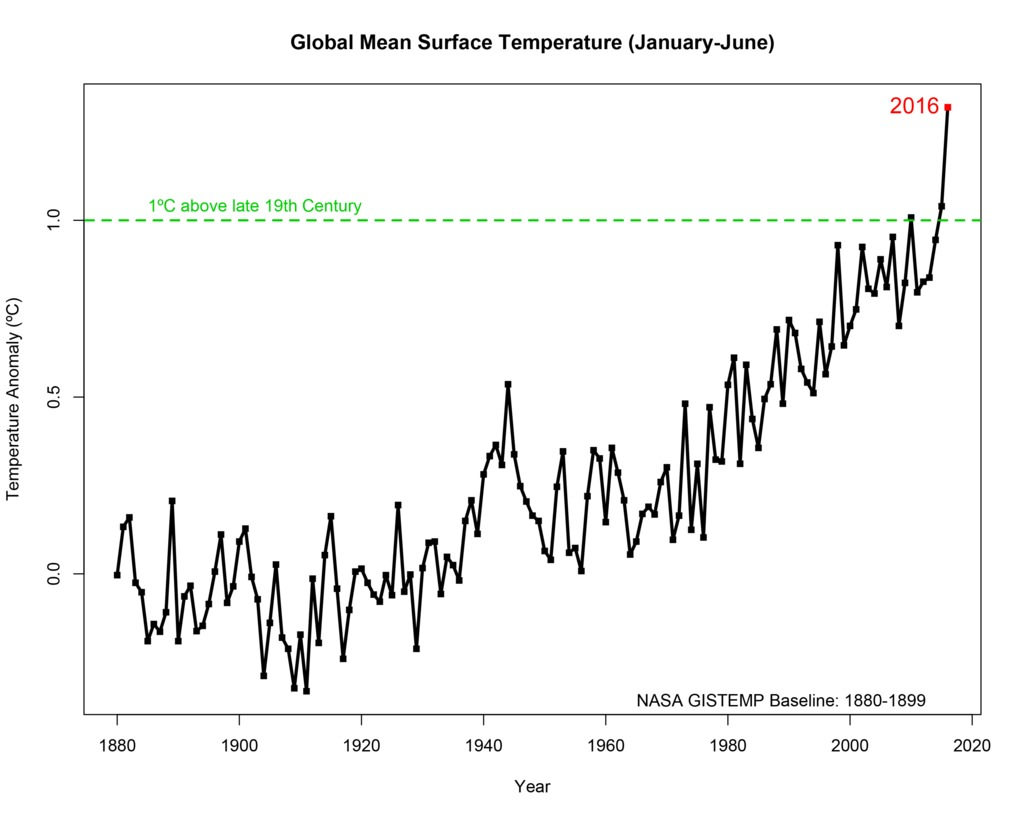
A comparison of the first six months of each year, going back to the start of reliable temperature records, in 1880. Credit: NASA/Goddard Institute for Space Studies
During a press briefing on Tuesday, Gavin Schmidt, the director of NASA’s Goddard Institute for Space Studies, said this record is “dancing” with the low-end targets set by the new Paris climate agreement in December of 2015, which proposed an optimistic 1.5oC limit to anthropogenic warming, compared to temperatures in the pre-industrial era.
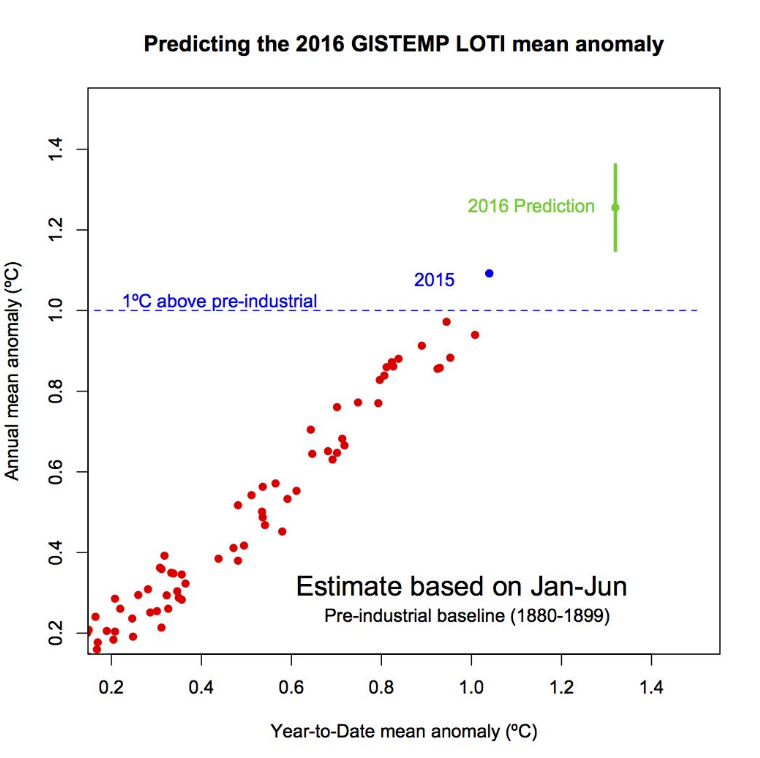
What does this mean for 2016?
All of this puts 2016 squarely on course to be the third “hottest year on record” in a row – an unprecedented streak in our record books – with roughly 99 per cent certainty.
Part of the reason for 2016 temperatures soaring far above all previous years is the record-setting El Niño that dominated the equatorial Pacific Ocean for most of 2015, however, it was not the dominant reason for it.
According to Schmidt, El Niño was only 40 per cent responsible for 2016 being hotter than 2015 so far. The other 60 per cent of the record heat is due to the increase in greenhouse gases in Earth’s atmosphere.
“While the El Niño event in the tropical Pacific this winter gave a boost to global temperatures from October onwards, it is the underlying trend which is producing these record numbers,” Schmidt said. in a NASA statement.
La Niña in the works?
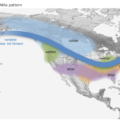
According to the latest update from NOAA’s Climate Prediction Center, their forecast shows that the odds of a La Niña developing by fall are still highest, compared to El Niño or “neutral” (neither El Niño nor La Niña), but only slightly. In previous forecasts, the probability of seeing a La Nina fully developed by Fall 2016 was around 60-70 per cent. Now, the chances have fallen to less than 50 per cent, and are only slightly higher than the odds of seeing a neutral scenario.
La Niña is the opposite of an El Niño, where the normal patterns of wind and water in the Pacific are kicked into overdrive, producing widespread colder-than-normal conditions in the eastern tropical Pacific. While El Niño 2015-2016 has officially dissipated, and temperatures in the tropical Pacific are cooler than normal, NOAA will not officially call a La Niña until there is solid evidence that the pattern has fully developed. This typically occurs when the ONI – the Oceanic Nino Index, which tracks a three-month running average of sea surface temperature anomalies in the central tropical Pacific – is at -0.5 or lower for at least three periods. Based on the current value of +0.7 up to the end of June, we’re not likely to see three consecutive ONI values at or below the La Nina threshold until at least the end of October.
Bucking the trend in 2017?
Whereas starting the year in an El Niño pattern tends to push global temperatures up, as we’ve seen in 2015 and 2016, if a La Niña develops before the start of 2017, it is unlikely that the year will become the fourth hottest on record in a row.
Simply look back to the years after 1998, right after we saw the last “super” El Niño.
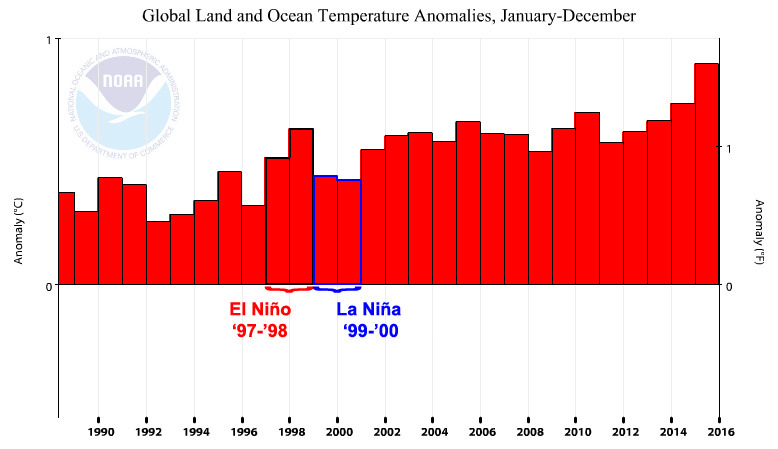
NOAA annual temperatures, highlighting the 1997-98 “super” El Niño and the La Niña that followed it, in 1999-2000. Credit: NOAA NCEI/S. Sutherland
At the time, 1997 had ranked as the warmest year on record, and 1998 took the top spot on that list the year after. Following these two warm years, however, 1999 and 2000 were comparatively cooler, and are the coolest years of the past 19-year period of NOAA’s records.
What happens in the year(s) to come will depend on how La Niña develops (if it develops at all). In some cases, a strong La Niña can form after a strong El Niño. In other cases, a weaker, longer-duration La Niña can develop. The La Niña that formed in 1999 was both strong and it lasted for over two and a half years.
One big difference now, compared to back then, is that the oceans are generally warmer now. Thus, any developing La Niña is facing far different conditions now compared to the 1998-2001 La Niña, and it remains to be seen what kind of impact that extra heat will have.
Regardless of the development of a La Niña and any associated cooling it brings on, it will have absolutely no impact on the long-term trend, of course. As seen in the graph above, after 2000, temperatures may have fluctuated year to year, but they were still generally rising, due to rising concentrations of greenhouse gases in the atmosphere. Regardless of a developing La Nina now, and its potential impact on the next year or two, that rise will continue as long as we continue to burn fossil fuels.
Source: NOAA, NASA
Categories: Definition, La Niña